السلام عليكم أثناء بحثي عن حل لمشكلة الرسم في الفيجوال وجدت هذا البرنامج الجيد والذي يحل المشكلة
http://www.chestysoft.com/download/csXGraphTrial.exe
عند تثبيت البرنامج ...
ستجد في components في الفيجوال ... خيارا اسمه cXGrapgh اختره ...
ثم أدرج الأداة draw في الفورم ..
كما أنك ستجد في مكان تثبيت البرنامج
مثالا مرفق وكذلك ملف التعليمات على شكل ملف PDF
وهذه بعض الرسمات التي يقوم بعملها البرنامج

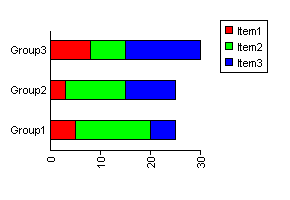
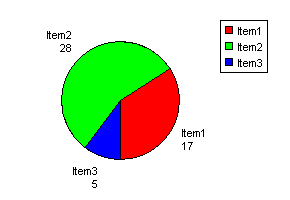
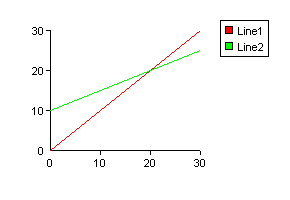
وهنا شرح كيفية عمل xy graph كما يلي
8.3. Line Graphs

The line graphs drawn by csXGraph are simple 2-D graphs on a single set of X and Y axes. Multiple
lines can be displayed on one graph if the lines are separate colours. By default the points are hidden
and the lines joining the points are shown. Changing the PointStyle property will make the points
appear and setting ShowLine to false will hide the graph lines and this arrangement can be used to draw
a type of scatter diagram.
The ClearData method is usually called before adding points in order to remove data from any
previously drawn graph. The GraphType property must be set to 3 to generate a bar chart. Finally, the
graph is drawn into the control by calling the DrawGraph method.

3.1. Line Graph Methods

AddPoint (X As Double, Y As Double, Colour As OLE_COLOR, LineName As String) - This
command adds a point to be plotted on a line graph. X and Y are the coordinates of the point, which
must be numeric values. Colour is the colour of the line. LineName is the string that will be displayed if
a legend is used. When the graph is plotted all the points that are the same colour will be joined by
straight lines going from point to point in the order they were added.
A separate call to AddPoint must be made for each point on the graph.
Example code for Visual Basic:
Chart.AddPoint 0, 0, vbRed, "Red Line"
Chart.AddPoint 30, 30, vbRed, ""
Chart.AddPoint 0, 0, vbGreen, "Green Line"
Chart.AddPoint 30, 20, vbGreen, ""
This would draw two lines, one in red and the other in green. Note that the name used in the legend is
the first value of LineName for each colour so an empty string can be used for the remaining entries.
ClearData ( ) - Removes all data items already added. Call this before AddPoint when
generating a new graph. It does not reset property values to their defaults.
DrawGraph ( ) - This method generates the graph. The type of graph generated depends on
the value of the GraphType property which must be 3 to produce a line graph.

3.2. Line Graph Properties

LineWidth - Long. Width of the graph lines in pixels. (1)
ShowLine - Boolean. Determines whether points are shown joined together. Set to false
for a scatter diagram. (true)
PointStyle - Enumeration. Determines the type of point that will be drawn. 0 - none, 1 -
dot, 2 - circle, 3 - diagonal cross, 4 - vertical cross. This property applies to all the graph lines. (0)
PointSize - Long. Size of the plotted point. (2)
XValuesVertical - Boolean. Determines the orientation of the x-axis values. When true, the
values are written up the page from bottom to top. (true)
HideHGrid - Boolean. Hides the horizontal grid lines, when ShowGrid is true. (false)
HideVGrid - Boolean. Hides the vertical grid lines, when ShowGrid is true. (false)
PrefixX - String. This value will be shown in front of the numeric values on the
x-axis. (null)
PrefixY - String. This value will be shown in front of the numeric values on the
y-axis. (null)
SuffixX - String. This value will be shown after the numeric values on the x-axis.
(null)
SuffixY - String. This value will be shown after the numeric values on the y-axis.
(null)
ShowSeparatorX - Boolean. When true, commas will be used to separate thousands on the
x-axis. (false)
ShowSeparatorY - Boolean. When true, commas will be used to separate thousands on the
y-axis. (false)
There are a large number of properties that can be used with line graphs that are described in other
sections of these instructions.

3.3. Line Graph Example

The following code fragment shows how a line graph can be drawn using Visual Basic.
Chart.ClearData
Chart.ShowGrid = True
Chart.YAxisText = "Y Axis"
Chart.XAxisText = "X Axis"
Chart.AxisTextFont.Bold = True
Chart.AddPoint 0, 0, vbRed, "Red Line"
Chart.AddPoint 30, 30, vbRed, ""
Chart.AddPoint 0, 0, vbGreen, "Green Line"
Chart.AddPoint 30, 20, vbGreen, ""
Chart.GraphType = dgtLine
Chart.DrawGraph
أرجو من محترفي البرمجة ... ومن الأخوة الكرام ...
ان يتكرموا علينا بشرح بسيط لطريقة رسم xy graph حيث اني حاولت ولم أفلح لأني مبتدئ في الفيجوال ..
والسلام